# Is there any way to change the color of a point of points of plot?
**URL:** https://racket.discourse.group/t/is-there-any-way-to-change-the-color-of-a-point-of-points-of-plot/3121
**Category:** Questions & Answers
**Created:** [August 23, 2024, 10:42pm UTC](https://racket.discourse.group/t/is-there-any-way-to-change-the-color-of-a-point-of-points-of-plot/3121 "2024-08-23T22:42:43Z")
**Posts on this page:** 12
**Page:** 1
### Author:  [@cametan](https://racket.discourse.group/u/cametan)
#### Post date: [August 23, 2024, 10:42pm UTC](https://racket.discourse.group/t/is-there-any-way-to-change-the-color-of-a-point-of-points-of-plot/3121/1 "2024-08-23T22:42:43Z")
Hello.
As the title says(ppp...), I am looking for the way to give different color respectively to each point which points of plot library.
```scheme
#lang racket
(require (only-in srfi/41 stream-iterate) plot)
(define (chaos p q d x0 y0)
(let ((a (* 2 (cos (* 2 pi (/ p q))))))
(let ((ksx (sqrt (/ (+ 2 a) 2))) (ksy (sqrt (/ (- 2 a) 2))))
(stream-map (lambda (z)
(match-let (((vector x y) z))
(vector (* (/ ksx (sqrt 2)) (+ x y))
(* (/ ksy (sqrt 2)) (+ (- x) y)))))
(stream-iterate (lambda (z)
(match-let (((vector x y) z))
(vector
(+ (* a x) y (/ (* d x) (add1 (expt x 2))))
(- x)))) (vector x0 y0))))))
(define *data* '((1 34 5 0.1 0 60000)
(1 26 5 0.1 0 90000)
(1 25 5 0.1 0 60000)
(1 13 5 0.1 0 60000)
(1 10 5 0.5 0 60000)
(1 8 5 0.1 0 60000)
(1 7 5 1 0 60000)
(2 13 5 1 0 60000)
(1 5 5 0.1 0 60000)
(3 14 5 0.1 0 60000)
(2 9 5 0.1 0 60000)
(3 13 5 0.1 0 60000)
(3 10 5 1 0 60000)
(8 25 5 0.1 0 60000)
(1 3 5 0.1 0 60000)
(6 17 5 0.5 0 60000)
(3 8 5 1 0 60000)
(5 13 5 0.1 0 60000)
(2 5 5 1 0 60000)
(7 17 5 0.1 0 60000)
(11 25 5 0.1 0 60000)
(6 13 5 1 0 90000)
(8 17 5 0.1 1 60000)))
(module+ main
(parameterize ((plot-x-label #f)
(plot-y-label #f))
(map (lambda (datum)
(match-let ((`(,p ,q ,d ,x ,y ,n) datum))
(plot
(points
(stream->list
(stream-take
(chaos p q d x y) n))
#:alpha 0.4
#:sym 'fullcircle1
#:color "blue" ;; how to change the color of a point, according to its co-ordinate?
)))) *data*)))
```
Thanks.
---
### Author:  [@damien\_mattei](https://racket.discourse.group/u/damien_mattei)
#### Post date: [August 25, 2024, 9:40pm UTC](https://racket.discourse.group/t/is-there-any-way-to-change-the-color-of-a-point-of-points-of-plot/3121/2 "2024-08-25T21:40:00Z")
Hello,
i do not think it is possible easily to change the color of particular plot because it seems the library is made to make single color plot for a set of points.
I think i have a solution that reuse some of my past code but do you know which function you want to use to define the color of a point?
i mean a function of the form color(x,y) which return an RGB color?
regards,
---
### Author:  [@sorawee](https://racket.discourse.group/u/sorawee)
#### Post date: [August 25, 2024, 10:15pm UTC](https://racket.discourse.group/t/is-there-any-way-to-change-the-color-of-a-point-of-points-of-plot/3121/3 "2024-08-25T22:15:59Z")
Note that the plot function can take a list of renderers. While it's true that you can only associate each renderer with a single color, you could instead have many renderers, where each renderer contains only one point. Something like this:
```scheme
#lang racket
(require plot
racket/random)
(define xs (map vector (range 0 10) (range 1 11)))
(define (random-color)
(random-ref '("brown" "red" "blue" "green")))
(plot
(map (λ (point)
(points (list point)
#:sym 'fullcircle1
#:color (random-color)))
xs))
```
---
### Author:  [@cametan](https://racket.discourse.group/u/cametan)
#### Post date: [August 25, 2024, 11:37pm UTC](https://racket.discourse.group/t/is-there-any-way-to-change-the-color-of-a-point-of-points-of-plot/3121/4 "2024-08-25T23:37:45Z")
Hello.
> [@damien\_mattei](#):
>
> i mean a function of the form color(x,y) which return an RGB color?
I did not assume the RGB. I mean a color reference on `plot` is related to a certain number, so, for instance, it is O.K. to let it proportional to the distance from the origin by using:
```scheme
(inexact->exact (round (magnitude (make-rectangle x y))))
```
> [@sorawee](#):
>
> Note that the plot function can take a list of renderers. While it's true that you can only associate each renderer with a single color, you could instead have many renderers, where each renderer contains only one point.
Hmm.
Yes, this got be the way to do.
Thanks, regards.
---
### Author:  [@damien\_mattei](https://racket.discourse.group/u/damien_mattei)
#### Post date: [August 26, 2024, 7:02am UTC](https://racket.discourse.group/t/is-there-any-way-to-change-the-color-of-a-point-of-points-of-plot/3121/5 "2024-08-26T07:02:27Z")
I think it can be done by two way :
-with plot the way sorawee explain it
-with racket/gui it is a bit harder to set it, i had a longer solution as you have to create frame,canvas etc
about the formula you use, you have then to reference colors but it will be discontinuous ,not sure this is the effect you want... unless you use a big palette of colors.
---
### Author:  [@cametan](https://racket.discourse.group/u/cametan)
#### Post date: [August 26, 2024, 1:09pm UTC](https://racket.discourse.group/t/is-there-any-way-to-change-the-color-of-a-point-of-points-of-plot/3121/6 "2024-08-26T13:09:00Z")
Hello.
> [@damien\_mattei](#):
>
> about the formula you use, you have then to reference colors but it will be discontinuous ,not sure this is the effect you want... unless you use a big palette of colors.
Here's the story.
I have got a very old book, published in the 1990's, talking about [Chaos theory](https://en.wikipedia.org/wiki/Chaos_theory), which was then famous. Yes, it is The Brundle Fly in Jurassic Park.
The book was focusing on some sorts of CG, programmed in the C... yes, that was using Borland Turbo C!
Wow!
Yes, at that time, the most people used MS-DOS, and the number of colors varied from 16 to 256.
Borland Turbo C had `graphics.h`, which is not included in the ISO standard as you know, and the book made this kind of library:
```scheme
/* ******************* */
/* BGI GRAPHIC LIBRARY */
/* ******************* */
#include
#include
#include
#include
#include
#include
#define PI 3.1415927
void settextcolor(int c) /* Setting text colors */
{
switch(c) {
case 0 : printf("\x1b[30m"); break;
case 1 : printf("\x1b[34m"); break;
case 2 : printf("\x1b[32m"); break;
case 3 : printf("\x1b[36m"); break;
case 4 : printf("\x1b[31m"); break;
case 5 : printf("\x1b[35m"); break;
case 6 : printf("\x1b[33m"); break;
default: printf("\x1b[m"); break;
}
}
void ginit(void) /* Initializing graphics */
{
int gerr;
int gdriver=PC98, gmode=PC98C16;
initgraph(&gdriver, &gmode, "A:\\TC\\BGI\\");
if ((gerr = graphresult) != grOk) {
printf("Error : %s\n", grapherrormsg(gerr));
exit(1);
}
settextcolor(15);
}
void close(void) /* Closing graphics */
{
setactivepage(1);
cleardevice();
setactivepage(0);
cleardevice();
closegraph();
settextcolor(15);
}
void set0(int x0, int y0) /* Setting the origin */
{
setviewport(x0, y0, 639, 339, 0);
}
```
I do not know what the heck it is talking about, though.
Anyway, I was looking for the information, that tells how to translate old-day-Borland-C code to the today's standard one, on the internet.
What I found was "use `GLUT`", which is related to `OpenGL`.
> Racket has `OpenGL` library, doesn't it...?
At least, it is obviously much better for me to write Racket codes than to do the C.
But searching `GLUT` here returns nothing.
In addition to that, `OpenGL` documentation here is written for `OpenGL` users. It is not for Racket users.
As a result, I changed my mind to use `plot` to see what happens and whether I could get colorful Chaos graphics.
This is the background of the program I have shown.
Thanks, regards.
---
### Author:  [@damien\_mattei](https://racket.discourse.group/u/damien_mattei)
#### Post date: [August 26, 2024, 2:09pm UTC](https://racket.discourse.group/t/is-there-any-way-to-change-the-color-of-a-point-of-points-of-plot/3121/7 "2024-08-26T14:09:20Z")
> [@cametan](#):
>
> ```scheme
> void settextcolor(int c) /* Setting text colors */
> {
> switch(c) {
> case 0 : printf("\x1b[30m"); break;
> case 1 : printf("\x1b[34m"); break;
> case 2 : printf("\x1b[32m"); break;
> case 3 : printf("\x1b[36m"); break;
> case 4 : printf("\x1b[31m"); break;
> case 5 : printf("\x1b[35m"); break;
> case 6 : printf("\x1b[33m"); break;
>
> ```
those are escape codes, ([I have](https://github.com/damien-mattei/snif-1.0/blob/master/terminal.h#L23)) used on Unix terminals :
> **[ANSI escape code](https://en.wikipedia.org/wiki/ANSI_escape_code)**
>
> ANSI escape sequences are a standard for in-band signaling to control cursor location, color, font styling, and other options on video text terminals and terminal emulators. Certain sequences of bytes, most starting with an ASCII escape character and a bracket character, are embedded into text. The terminal interprets these sequences as commands, rather than text to display verbatim.
> ANSI sequences were introduced in the 1970s to replace vendor-specific sequences and became widespread in the ...
chance i have used that in the past because i could not have understood if not... but forget that, this is old stuff ,even if it is still usefull in terminals.
GPU are used for 3D , OpenGL i did used it, CUDA too but for computation... i'm thinking for a solution ,but it is not finished, for now with your code modified i have this result, that use :

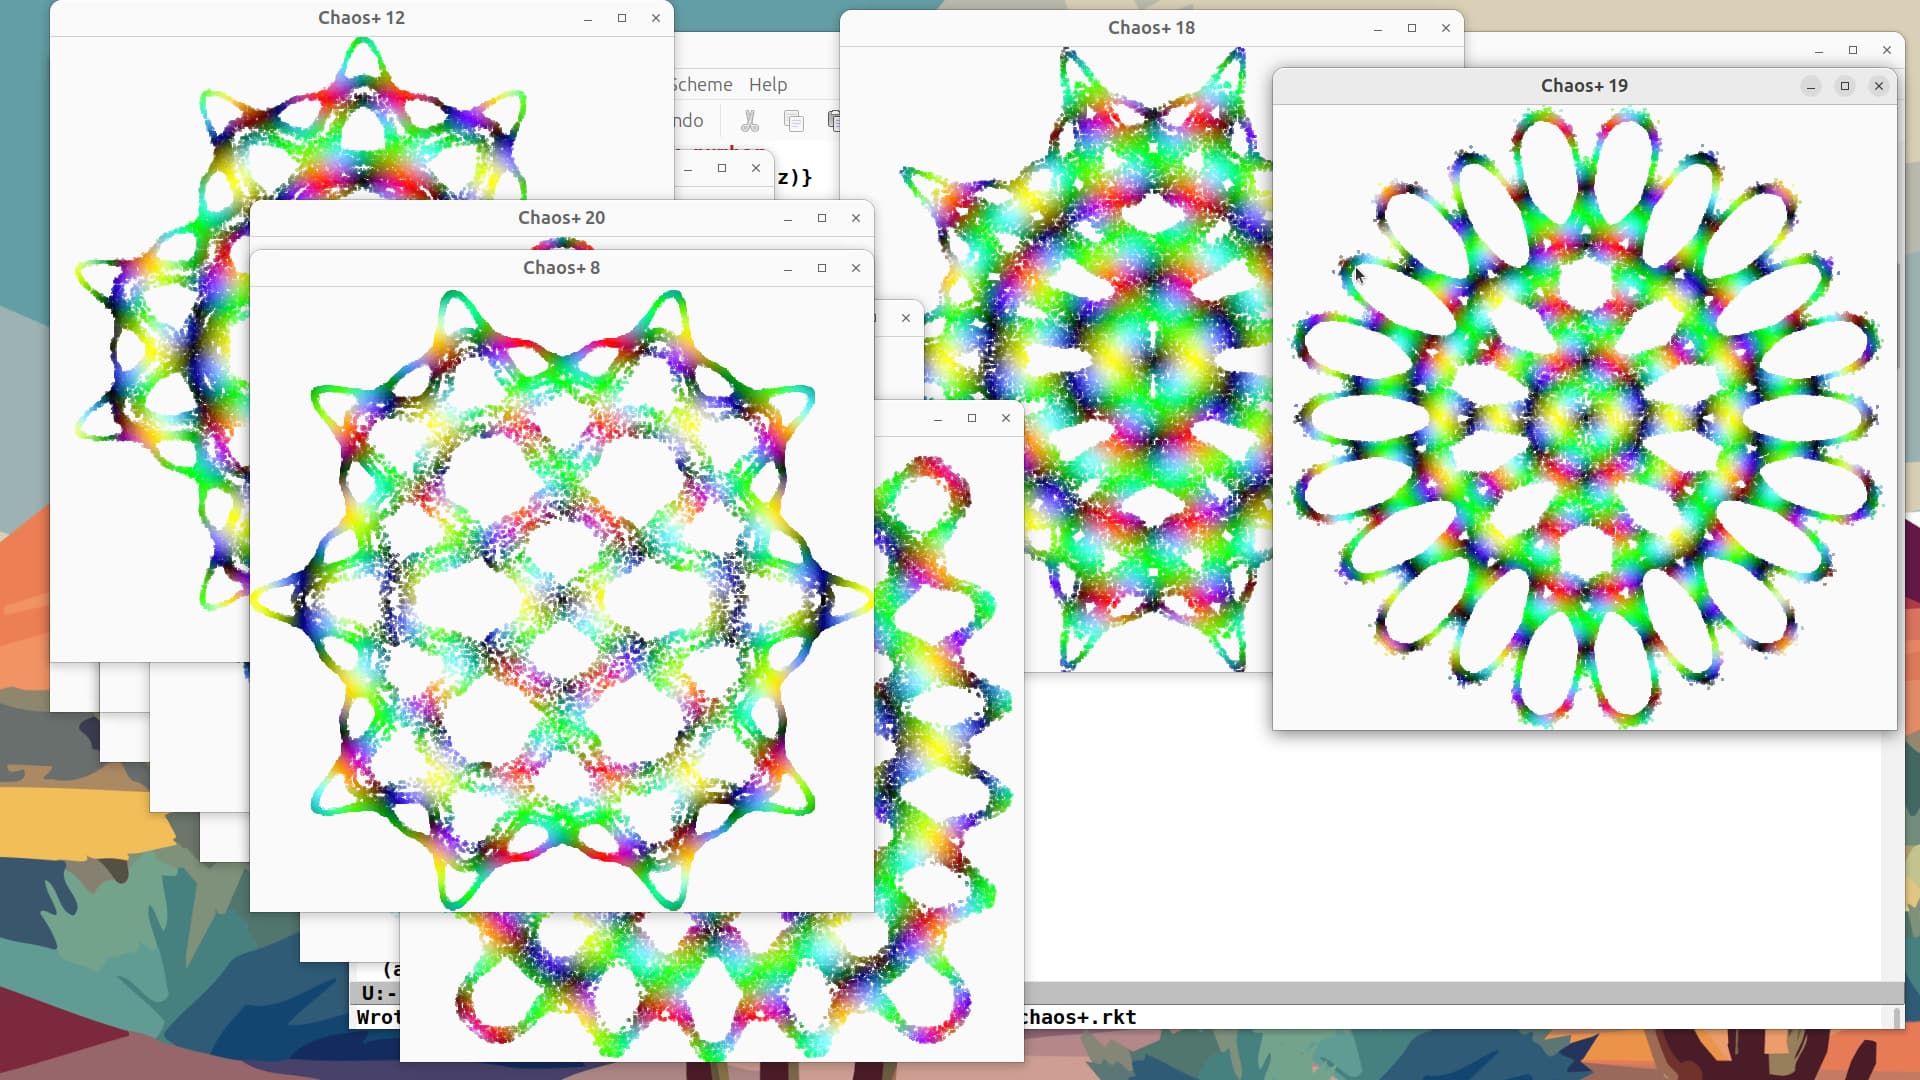
i'm using mathematicals trigonometric function and i code in a modified scheme, but here is the Racket code ;for x, y of your coordinates:
you need to define a [color%](https://docs.racket-lang.org/draw/color_.html) in RGB
```scheme
(define red-val
(inexact->exact (abs (round (* 255 (red-value x y))))))
(define green-val
(inexact->exact (abs (round (* 255 (green-value x y))))))
(define blue-val
(inexact->exact (abs (round (* 255 (blue-value x y))))))
(define rgb-color (make-object color% red-val green-val blue-val))
(define point-brush (new brush% (color rgb-color)))
```
original code:
```scheme
;; compute the RGB color
(define red-val (inexact->exact (abs (round {255 * (red-value x y)}))))
(define green-val (inexact->exact (abs (round {255 * (green-value x y)}))))
(define blue-val (inexact->exact (abs (round {255 * (blue-value x y)}))))
;; create the color
(define rgb-color (make-object color% red-val
green-val
blue-val
0.5 ; translucent
))
;; create brush
(define point-brush (new brush% [color rgb-color]))
```
and i use those math functions:
```scheme
(define (remove-extrema x) (define gap 0.2) (+ gap (* (- 1.0 (* 2 gap)) x)))
(define (f x y) (abs (* (sin x) (cos y))))
(define (f-trunc x y) (remove-extrema (f x y)))
(define (g x y) (abs (sin (sqrt (+ (**x 2) (** y 2))))))
(define (g-trunc x y) (remove-extrema (g x y)))
(define (h x y) (abs (* (cos (+ x y)) (sin (- x y)))))
(define (h-trunc x y) (remove-extrema (h x y)))
(define (red-value x y) (f x y))
(define (green-value x y) (g x y))
(define (blue-value x y) (h x y))
```
original code was:
```scheme
;; remove a gap at minimum and maximum and return a value in [gap,1-gap]
(define (remove-extrema x)
(define gap 0.2)
{gap + {1.0 - 2 * gap} * x})
(define (f x y)
(abs {sin(x) * cos(y)}))
(define (f-trunc x y)
(remove-extrema (f x y)))
(define (g x y)
(abs (sin (sqrt {x **2 + y** 2}))))
(define (g-trunc x y)
(remove-extrema (g x y)))
(define (h x y)
(abs {cos{x + y} * sin{x - y}}))
(define (h-trunc x y)
(remove-extrema (h x y)))
(define (red-value x y)
(f x y))
(define (green-value x y)
(g x y))
(define (blue-value x y)
(h x y))
```
but i think it is better to do a gradient of color with distance, i'm coding it with this but it is not yes finished...
interesting.... and pretty images....
---
### Author:  [@damien\_mattei](https://racket.discourse.group/u/damien_mattei)
#### Post date: [August 27, 2024, 11:40am UTC](https://racket.discourse.group/t/is-there-any-way-to-change-the-color-of-a-point-of-points-of-plot/3121/8 "2024-08-27T11:40:45Z")
a link to an understandable [implementation and algorithm for continuous long rainbow gradient](https://www.particleincell.com/2014/colormap/).
and a scheme implementation below:
(here the scheme equivalent of `:=` is `define`)
```scheme
(define (scalar-to-long-rainbow-rgb s)
(:= a (/ (- 1 s) 0.2))
(:= x (inexact->exact (floor a)))
(:= y (inexact->exact (floor (* 255 (- a x)))))
(case x
((0) (values 255 y 0))
((1) (values (- 255 y) 255 0))
((2) (values 0 255 y))
((3) (values 0 (- 255 y) 255))
((4) (values y 0 255))
((5) (values 255 0 255))
(else
(display "s=")
(display s)
(newline)
(display "a=")
(display a)
(newline)
(display "x=")
(display x)
(newline)
(error "else in scalar-to-long-rainbow-rgb"))))
```
Scheme+ original code:
```scheme
;; get a normalized scalar between [0,1] and return the values of red, green and blue of the color in the long rainbow
(define (scalar-to-long-rainbow-rgb s)
{a := {1 - s} / 0.2} ; invert and group
{x := (inexact->exact (floor a))} ; this is the integer part
{y := (inexact->exact (floor {255 * {a - x}}))} ; fractional part from 0 to 255
(case x
((0) (values 255 y 0))
((1) (values {255 - y} 255 0))
((2) (values 0 255 y))
((3) (values 0 {255 - y} 255))
((4) (values y 0 255))
((5) (values 255 0 255))
(else
(display "s=") (display s) (newline)
(display "a=") (display a) (newline)
(display "x=") (display x) (newline)
(error "else in scalar-to-long-rainbow-rgb"))))
```
and can be used like this:
```scheme
(define s (sqrt (/ (norm x y) max-norm-x-y)))
(<- (red-val green-val blue-val) (scalar-to-long-rainbow-rgb s))
(define rgb-color (make-object color% red-val green-val blue-val))
```
`<-` can be replaced with `define-values` i do not remember well...
or original code:
```scheme
(define s (sqrt {(norm x y) / max-norm-x-y})) ; normalized scalar
{(red-val green-val blue-val) <- (scalar-to-long-rainbow-rgb s)} ;; multi-values assignment/definition
;; create the color
(define rgb-color (make-object color% red-val
green-val
blue-val
;;0.5 ; translucent
))
```

i must admit... a bit seventies psychedelic... 😅
---
### Author:  [@JustinZed](https://racket.discourse.group/u/JustinZed)
#### Post date: [August 27, 2024, 1:36pm UTC](https://racket.discourse.group/t/is-there-any-way-to-change-the-color-of-a-point-of-points-of-plot/3121/9 "2024-08-27T13:36:14Z")
An easy way to get a rainbow gradient is to use HSV instead of RGB.
```scheme
#lang racket
(require pict)
(require colors)
(define (fill-rect color)
(filled-rectangle 20 20 #:draw-border? #f #:color (hsv->color (hsv color 0.3 0.9))))
(for/fold ([horiz (blank 0 0)])
([hue (in-range 0 1 (/ 1 27))])
(ht-append horiz (fill-rect hue)))
```

---
### Author:  [@damien\_mattei](https://racket.discourse.group/u/damien_mattei)
#### Post date: [August 27, 2024, 5:18pm UTC](https://racket.discourse.group/t/is-there-any-way-to-change-the-color-of-a-point-of-points-of-plot/3121/10 "2024-08-27T17:18:22Z")
yes i searched but did not find.

like my Oakley Orange Iridium Razor Blade model sunglasses of the early '90 😂
---
### Author:  [@damien\_mattei](https://racket.discourse.group/u/damien_mattei)
#### Post date: [August 28, 2024, 1:21pm UTC](https://racket.discourse.group/t/is-there-any-way-to-change-the-color-of-a-point-of-points-of-plot/3121/11 "2024-08-28T13:21:18Z")
the code of the solution is right but with a few data points, when running on the whole data of the problem it seems impracticable because it is slow and ran out of memory. (on a just new intel i7 with 16Gb)

i increased Racket memory but i'm still waiting ( more than 5 minutes) with no end. The gui solution ran in half minutes but the plot solution does not finish and require more and more memory.
Even with increased memory:

I ran exactly this code:
```scheme
#lang racket
(require (only-in srfi/41 stream-iterate)
plot
racket/random)
(define (chaos p q d x0 y0)
(let ((a (* 2 (cos (* 2 pi (/ p q))))))
(let ((ksx (sqrt (/ (+ 2 a) 2))) (ksy (sqrt (/ (- 2 a) 2))))
(stream-map (lambda (z)
(match-let (((vector x y) z))
(vector (* (/ ksx (sqrt 2)) (+ x y))
(* (/ ksy (sqrt 2)) (+ (- x) y)))))
(stream-iterate (lambda (z)
(match-let (((vector x y) z))
(vector
(+ (* a x) y (/ (* d x) (add1 (expt x 2))))
(- x)))) (vector x0 y0))))))
(define *data* '((1 34 5 0.1 0 60000)
(1 26 5 0.1 0 90000)
(1 25 5 0.1 0 60000)
(1 13 5 0.1 0 60000)
(1 10 5 0.5 0 60000)
(1 8 5 0.1 0 60000)
(1 7 5 1 0 60000)
(2 13 5 1 0 60000)
(1 5 5 0.1 0 60000)
(3 14 5 0.1 0 60000)
(2 9 5 0.1 0 60000)
(3 13 5 0.1 0 60000)
(3 10 5 1 0 60000)
(8 25 5 0.1 0 60000)
(1 3 5 0.1 0 60000)
(6 17 5 0.5 0 60000)
(3 8 5 1 0 60000)
(5 13 5 0.1 0 60000)
(2 5 5 1 0 60000)
(7 17 5 0.1 0 60000)
(11 25 5 0.1 0 60000)
(6 13 5 1 0 90000)
(8 17 5 0.1 1 60000)))
(define (random-color)
(random-ref '("brown" "red" "blue" "green")))
(module+ main
(parameterize ((plot-x-label #f)
(plot-y-label #f))
(map (lambda (datum)
(match-let ((`(,p ,q ,d ,x ,y ,n) datum))
(define lst-points (stream->list
(stream-take
(chaos p q d x y) n)))
(plot
(map (λ (point)
(points (list point)
;;#:alpha 0.4
#:sym 'fullcircle1
#:color (random-color) ; "blue" ; (compute-rgb-color point max-norm-x-y))) ;; change the color of a point according to its co-ordinate
))
lst-points))))
*data*)))
```
---
### Author:  [@damien\_mattei](https://racket.discourse.group/u/damien_mattei)
#### Post date: [August 28, 2024, 1:47pm UTC](https://racket.discourse.group/t/is-there-any-way-to-change-the-color-of-a-point-of-points-of-plot/3121/12 "2024-08-28T13:47:29Z")
Finally got the output while i was going out to take an extra battery i had in car as the battery laptop was low...
The screenshot show the delta time ,less than half hour, but i really do not know when it finished as i was out ,i will make a chrono with color depending with distance , not just random color picked:

to avoid overloading the memory a solution is to split the data in 2 groups:
```scheme
;; (define *data* '((1 34 5 0.1 0 60000)
;; (1 26 5 0.1 0 90000)
;; (1 25 5 0.1 0 60000)
;; (1 13 5 0.1 0 60000)
;; (1 10 5 0.5 0 60000)
;; (1 8 5 0.1 0 60000)
;; (1 7 5 1 0 60000)
;; (2 13 5 1 0 60000)
;; (1 5 5 0.1 0 60000)
;; (3 14 5 0.1 0 60000)
;; (2 9 5 0.1 0 60000)))
(define *data* '((3 13 5 0.1 0 60000)
(3 10 5 1 0 60000)
(8 25 5 0.1 0 60000)
(1 3 5 0.1 0 60000)
(6 17 5 0.5 0 60000)
(3 8 5 1 0 60000)
(5 13 5 0.1 0 60000)
(2 5 5 1 0 60000)
(7 17 5 0.1 0 60000)
(11 25 5 0.1 0 60000)
(6 13 5 1 0 90000)
(8 17 5 0.1 1 60000)))
```
and plot them one after the other but it is still requiring almost 8Gb of memory for plot library in Racket:

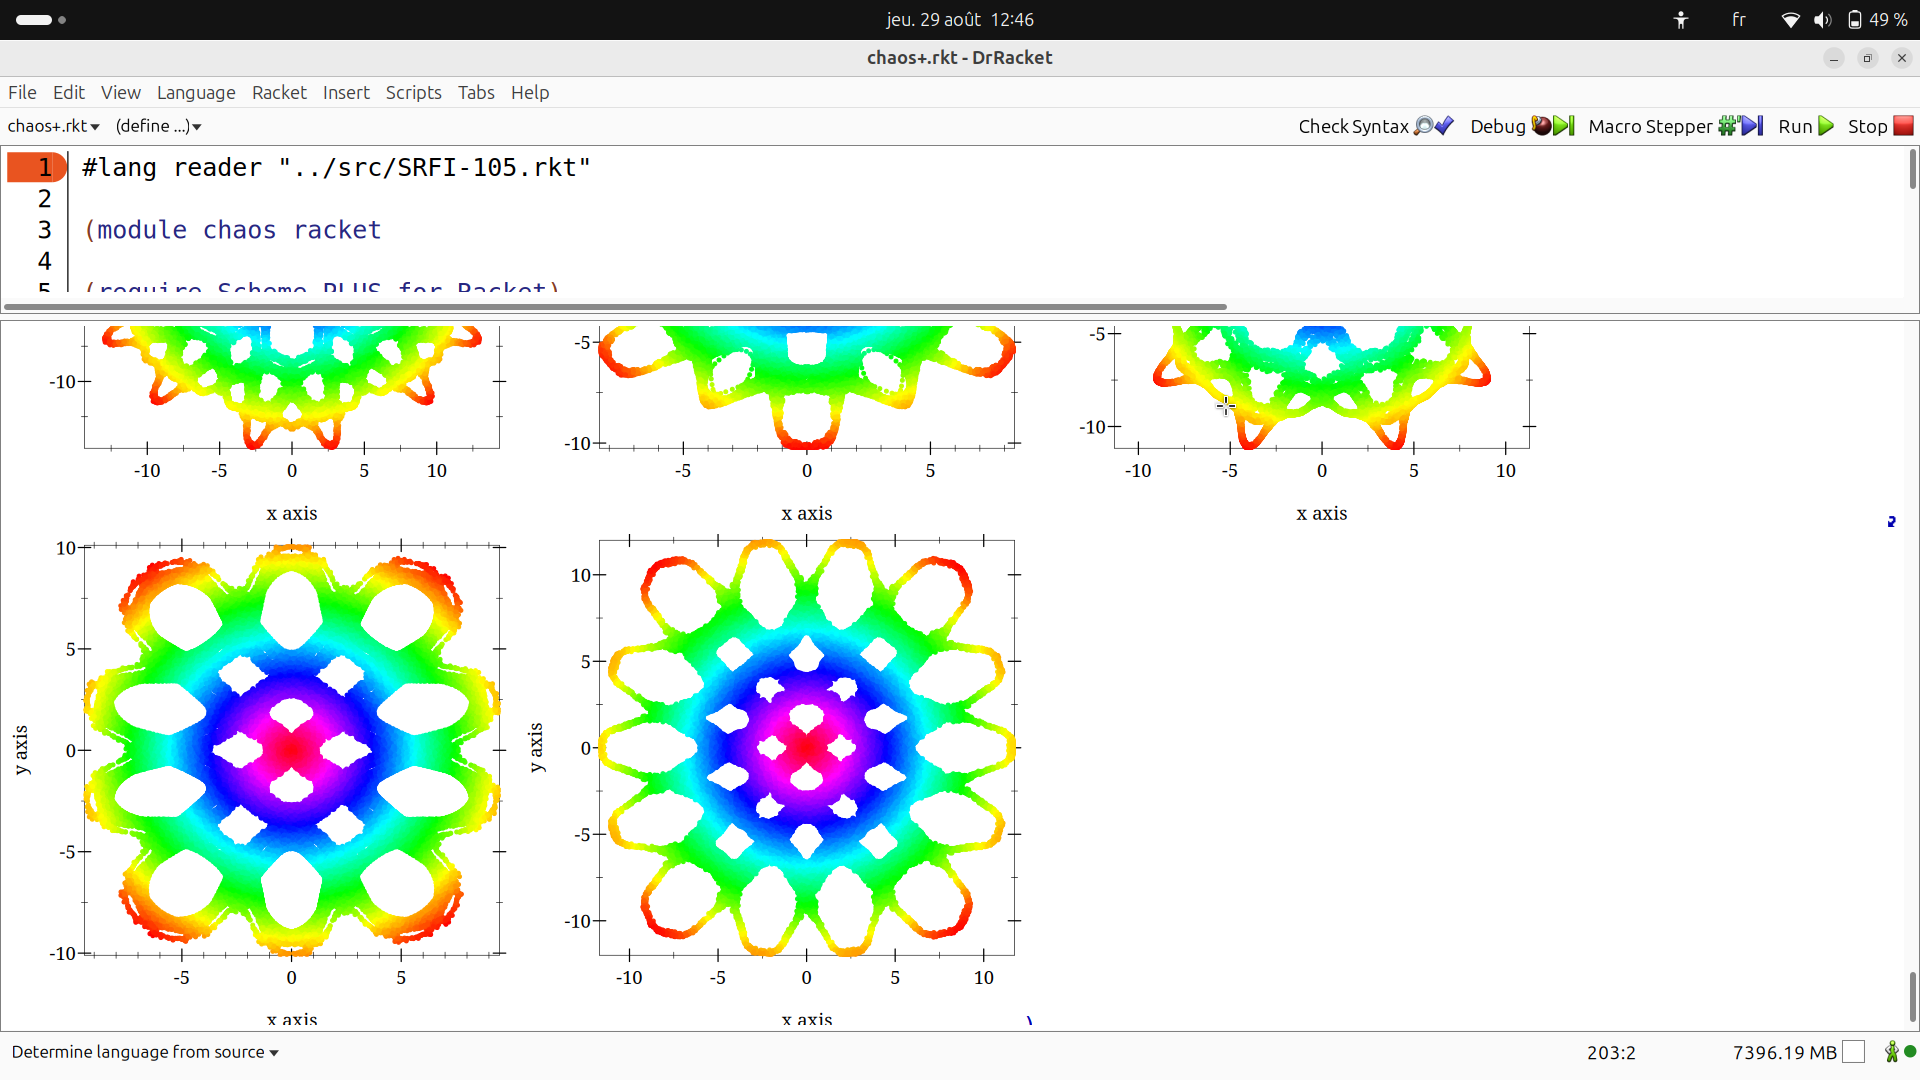
and takes 20 minutes with plot against a dozen of seconds in graphical mode.
```scheme
(plot
(map (λ (point)
(points (list point)
;;#:alpha 0.4
#:sym 'fullcircle1
#:color (compute-rgb-color-from-hsv point max-norm-x-y) ;(compute-rgb-color point max-norm-x-y) ;; change the color of a point according to its co-ordinate
))
lst-points))
```
comparaison with GUI (note i now use HSV for colors both for plot and gui) where it takes a dozen of seconds and only 843Mb of memory:

i will try to write an R6RS version of the full code as example ...